On the floor of the range, with selling pressure fading
The Nasdaq 100 closed at 27,197 (−2.67%), right on the floor of the range it has held since May. The pullback looks sharp on the day, but the bigger picture shows a correction that is running out of selling pressure.
What the price chart says
- Since May the index has traded in a wide range of roughly 27,200 to 31,300.
- From the October peak near 31,300, the index corrected about 13% back to the range floor.
- The 27,200 level has acted as support twice: in late July, and again in early November.
- In early November the index briefly broke below support, to around 26,700, and buyers pulled it straight back inside the range. That is a classic failed breakdown, which often marks the end of a correction.
- Today's close is a retest of the same support zone.
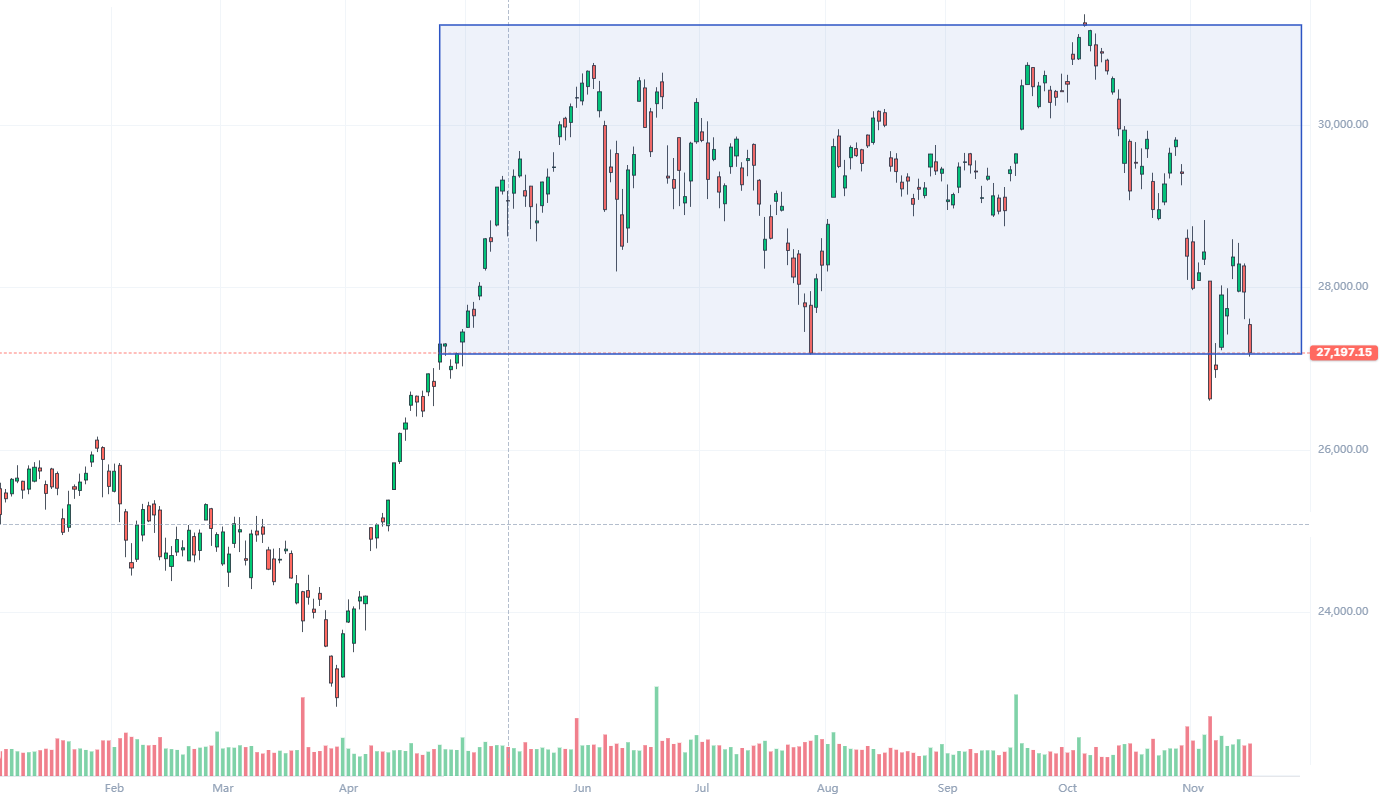
Nasdaq 100 daily: range of roughly 27,200–31,300 since May, with price retesting the floor.
What TruePrice.cash's Accumulation indicator says
The TruePrice.cash analysts use the Accumulation indicator to see whether real buying power is behind price moves. Unlike the Dow, the Nasdaq picture is constructive.
- After bottoming near −1,200 earlier in the year, the indicator turned up and crossed above zero.
- It reached about 1,050, its highest level on the chart, during the latest push to the top of the range.
- During the correction it dipped only briefly below zero, to about −200, and then quickly climbed back to around 690.
- It now stands near 150, still in positive territory. Buyers have been absorbing the selling instead of leaving.
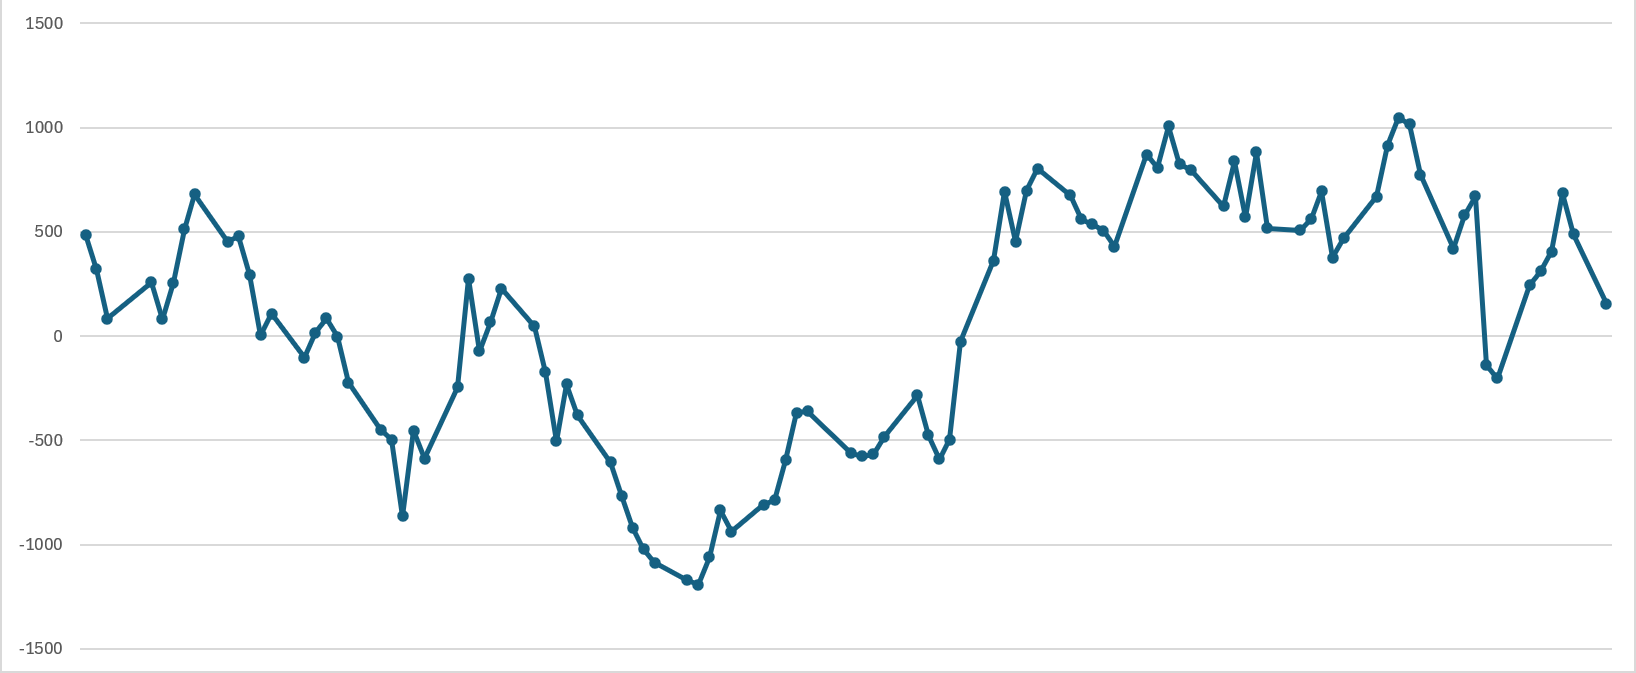
Accumulation indicator: positive overall, with only a brief dip below zero during the correction.
Why it matters
A correction is ending when price holds a key support and accumulation stays positive. Both conditions are in place: 27,200 has held on a closing basis, and the Accumulation indicator stayed above zero through most of the pullback. What remains is confirmation from the price itself.
The view from TruePrice.cash
One green candle away
A green daily close tomorrow that holds above 27,200 would confirm that the Nasdaq 100 is exiting the correction phase and resuming its move inside the range.
The level to watch
A daily close below 27,200, especially a repeat of the move toward 26,700, would delay that confirmation.
The setup is in place. Now the market has to confirm it.
One candle from confirmation.
Support has held and Accumulation is still positive. A green close above 27,200 is what would confirm the exit.
Disclaimer
This is for educational purposes only and is not an investment recommendation. Do your own research.