Seven red weeks, and the weekly chart is calmer
NVIDIA closed the week at 125.53 USD, after nearly seven straight down weeks from its October peak near 243. That is a drop of almost 48%, and the headlines are loud. The weekly chart tells a calmer story.
What the weekly chart says
- The rectangle on the chart marks the major support zone at about 92–107 USD.
- This zone held twice before. It stopped the sell-off in mid-2024 and again in April 2025, and both times it launched a new leg higher.
- Even after this sharp fall, the price is still about 17% above the top of that zone.
- The rule is simple: as long as weekly closes stay above this rectangle, the long-term uptrend is intact. Only a clear weekly break below it would turn the trend down.
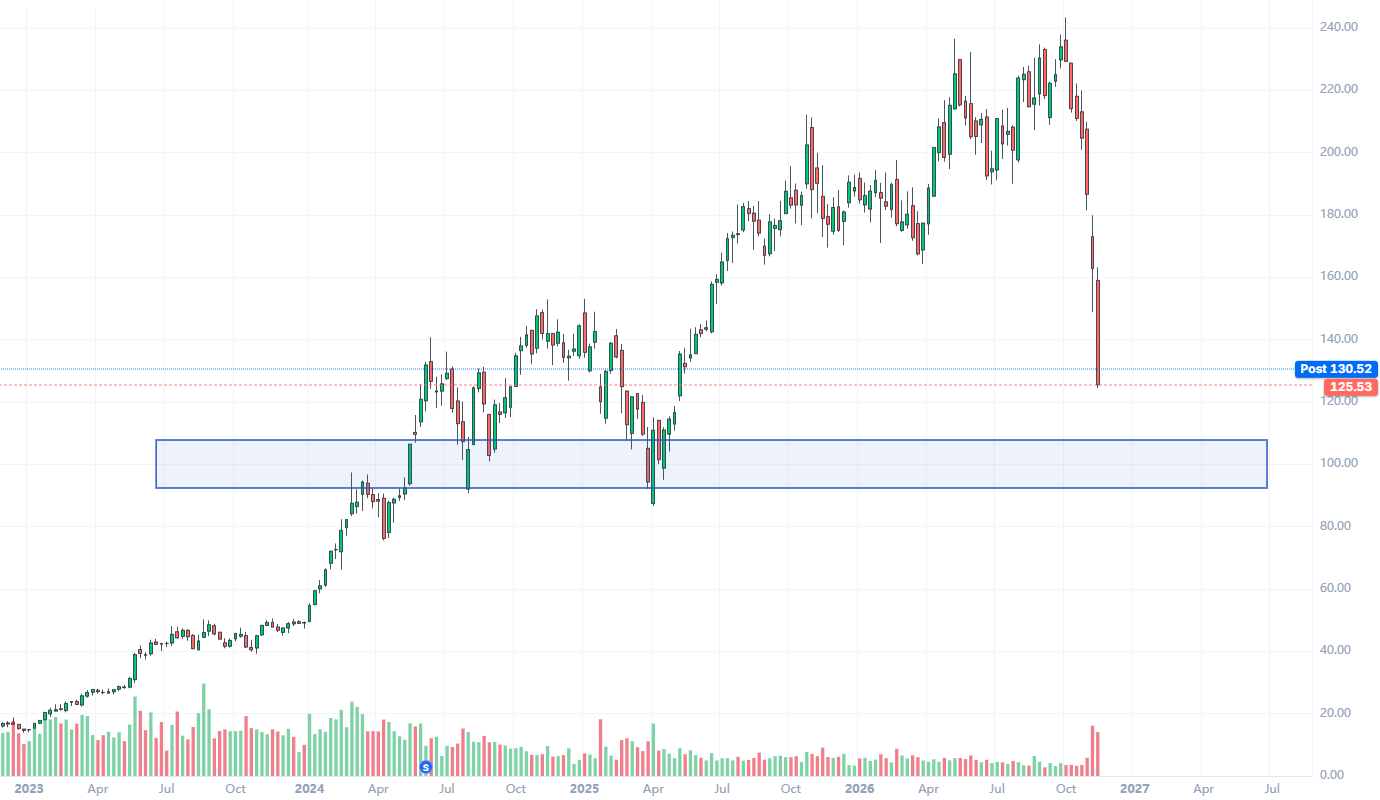
NVDA weekly: the rectangle marks the 92–107 support zone that defines the uptrend. Chart levels are approximate.
What the weekly Accumulation indicator says
The TruePrice.cash analysts track weekly accumulation to see whether long-term money is leaving the stock. So far it isn't.
- Accumulation has climbed steadily since 2024, from about 2.5 to a peak near 26 in May 2026.
- During this sell-off it eased to about 20.6, roughly the level of early 2025, and it is still far above zero.
- The divergence matters. The price fell almost 48%, but accumulation dropped only about 18% from its peak. Most of the long-term holdings built over two years are still in place.
- This reading supports the view that the uptrend is still in force and that the support zone should hold.
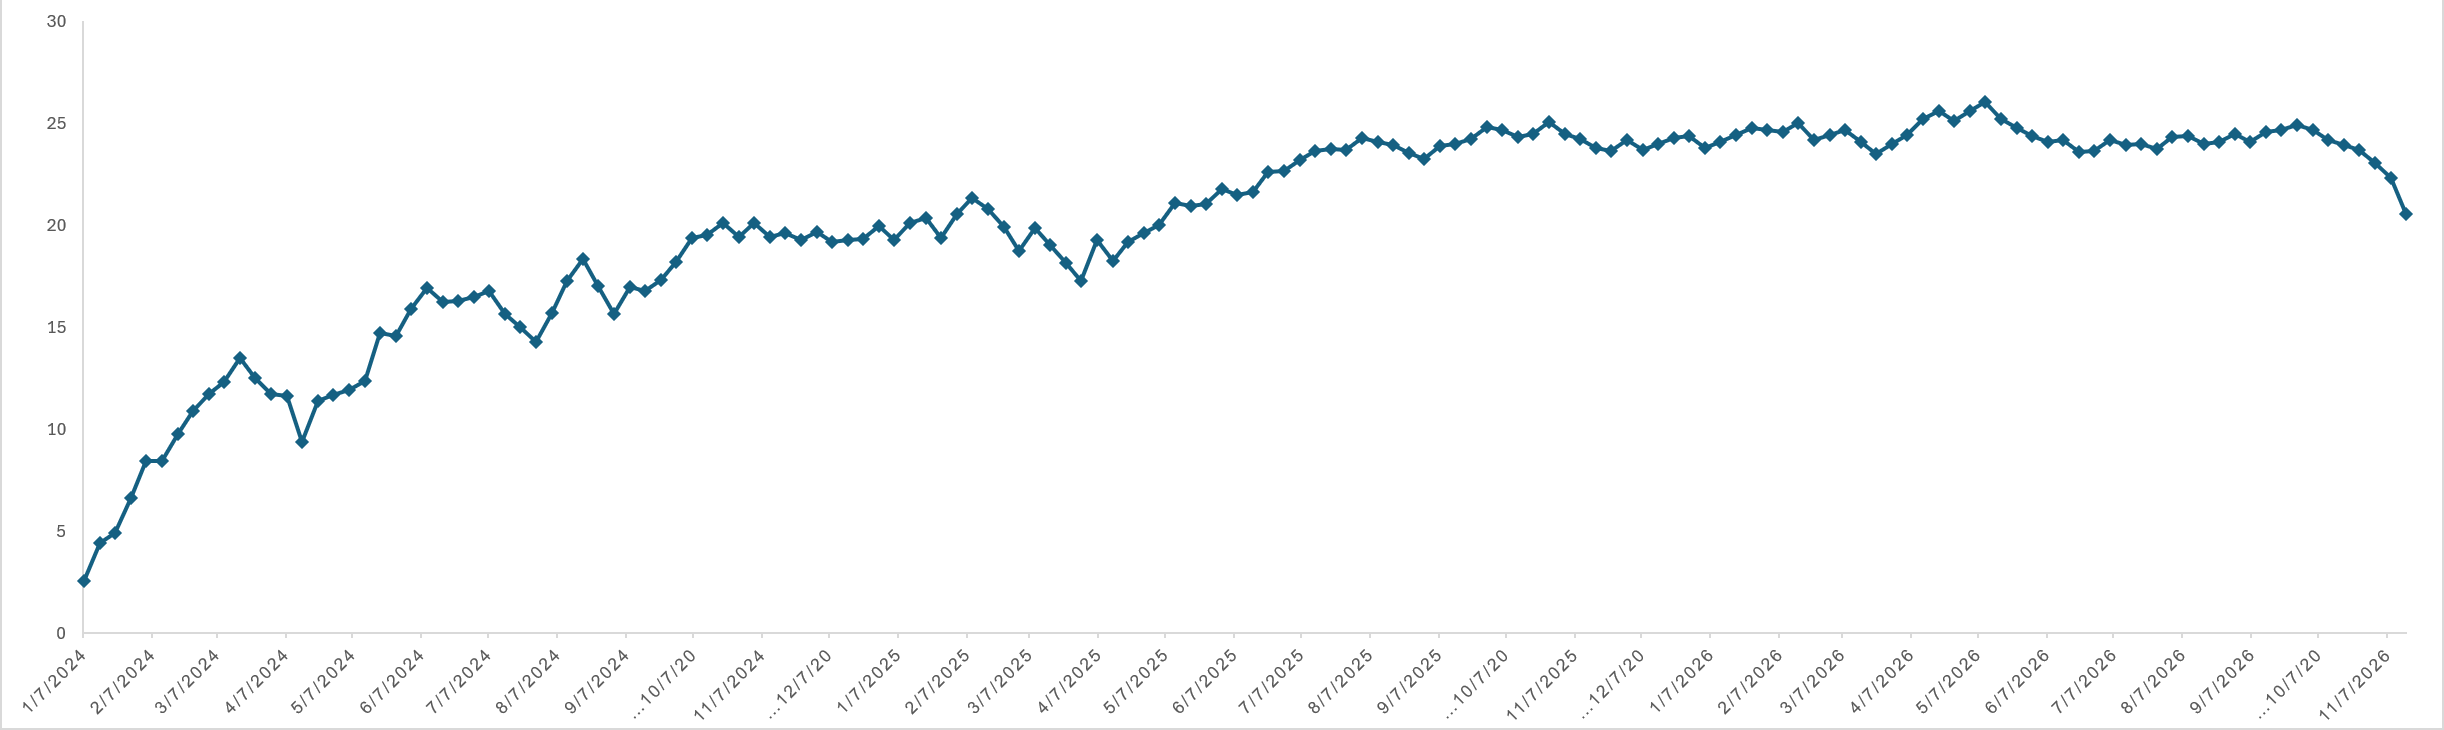
Weekly Accumulation for NVIDIA: easing, but still near its multi-year highs.
Why the sharp drop?
In TruePrice.cash's view, this looks like a shake-out rather than a change in trend. Large market players often push a strong stock down hard to shake out weaker holders, then buy back in from lower levels and build their positions for the next leg up. Steady accumulation during a steep price drop is what that pattern usually looks like.
Fair value on TruePrice.cash
| Method | Fair value | Versus the current price |
|---|---|---|
| DCF | 228.06 USD | +81.7% |
| EV | 186.63 USD | +48.7% |
| P/S and earnings | about 186.5 USD | +48.5% |
| Price / fair value | 0.67x | Undervalued |
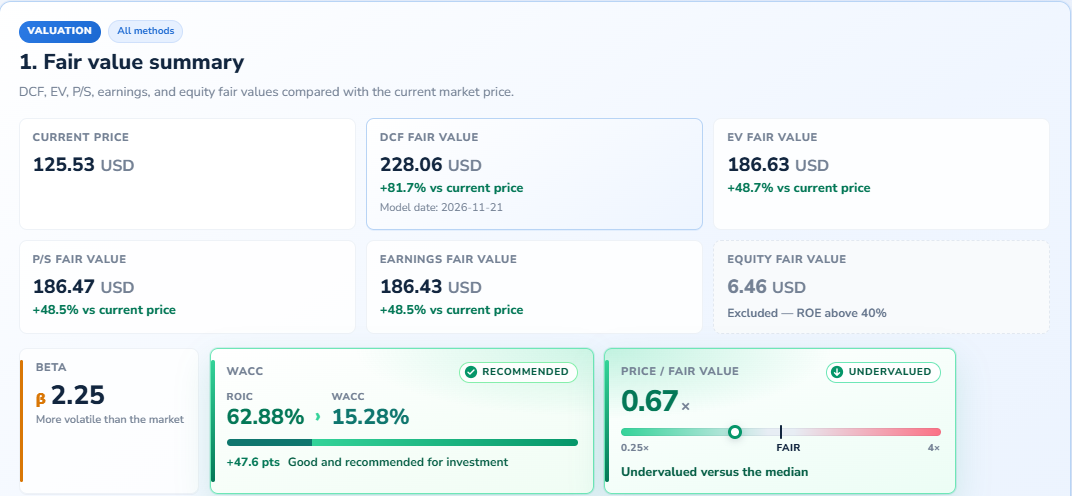
NVIDIA fair value summary on TruePrice.cash, report date 22 November 2026. NVIDIA fair value on TruePrice.cash.
The view from TruePrice.cash
The trend is still up.
The 92–107 support zone is unbroken, and weekly accumulation remains strong.
The valuation is attractive.
Every TruePrice.cash valuation model puts the stock well below fair value.
The line in the sand.
A clear weekly close below the rectangle would change the picture and turn the trend down. Until then, this is a correction within an uptrend.
Panic is loud. Accumulation is quiet. Follow the quiet money.
The uptrend is still intact.
Weekly closes are still above the 92–107 zone, and accumulation has given up only a fraction of a much larger price drop.
Disclaimer
This is for educational purposes only and is not an investment recommendation. Do your own research.